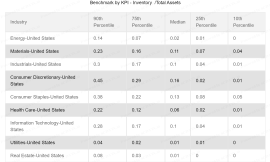
Inventory/ Total Asset for Level 1 Industry group of US 2019
2
Hello everyone. This is Raj. Today we will analyse in which industry the inventory is important by using KPI of Inventory as percentage of total assets. Here we will observe two countries US and China, various industries and find a comparison within those countries.
First of all, this slide shows various industries that exist within US and its inventory over total Assets for Level 1 industry Sectors for the year 2019. We can see that companies in the industry sectors of Energy, materials, consumer discretionary, consumer staple, healthcare and IT have a sizable asset in inventory. In particular, the median firm in consumer discretionary such as autos, apparel, home appliances and retail has 16 percent of asset in inventory, and the 90th percentile has 45 percent of its asset in inventory. Also in consumer staples, where the Median industries have 13 percent of assets inventory and 90th percentile has 38 percent. Material industry where we can also observe that median industry have 11 percent and 90th percentile can have 23 percent tied up in inventory. Although the median of IT, Industrials firms is only 1 percent but 90th percentile can go up to 28 3 percent. So for these industries, inventory simply cannot be ignored.
2/21
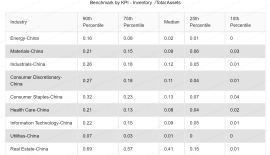
Inventory/ Total Asset for Level 1 Industry group of China 2019
3
Similarly, we can also observe China's industry as well, where the majority of inventory is tied up in Real Estate followed up by industries like consumer staples, industrials and consumer discretionary. The Real Estate in China has the highest percentage of asset in inventory, with median of 41 percent of assets inventory, and 90th percentile can go up to 69 percent. Following the table we can observe that 13 percent for the consumer staples ( where 90th percentile is 32%), 12 percent for industrials (where 90th percentile is 26%) are assets in inventory.
3/21
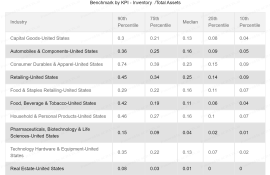
Inventory/ Total Asset for Level 2 Industry group of US 2019
4
We drilled deeper to observe the Level 2 industrial group of US. We picked capital goods, food staple retailing, retailing and food beverage, tobacco and so on for our analysis. For US, as we can see, retailing, such as department stores, has the highest percentage of asset in inventory with a median of 25 percent, followed by consumer durables & apparel which accounts for 23 percent and its 90th percentile can go up to 74 percent as well (which is the highest).
4/21
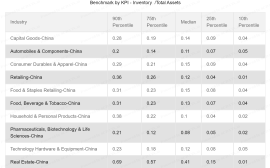
Inventory/ Total Asset for Level 2 Industry group of China 2019
5
We drilled deeper to observe the Level 2 industrial group of China. We picked capital goods, food staple retailing, retailing and food beverage, tobacco and so on for our analysis. In case of China, as we can see, the number 1 industry in inventory over total asset ratio is real estate, with a median of 41 percent, followed by consumer durables & apparel and food  & staples Retailing both with 15 percent and their 90th percentile can go up to 29 & 36 percent. Following the queue, there is capital goods, Food, beverage & Tobacco and retailing industries and technology hardware & equipment industries.

The answer to the question for which industries inventory management is more important depends on the country. Inventory management is important for food staple retailing, consumer durables and apparel for both US and China. The analysis indicates that inventory management for retailing is more important for the US than China, whereas inventory management for real estate is very crucial for China than US.
5/21
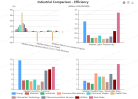
Industrial Comparison - Efficiency-USA- 2019
7
This slide shows all the Level 1 industrial comparison of 2019, with the analysis module as Efficiency for US. The analysis compares these industries on cost efficiency, labour productivity, inventory turns, and market power. The bottom left graph shows that Healthcare in the US has the lowest inventory turns, which is followed by IT , consumer discretionary, materials, consumer stable and so on. Also, the return on assets and median return on invested capital is negative in case of Health Care industry. for the year 2019. Similarly, Labour productivity and Median payable Days/ receivable is highest in case of Real Estate industry compared to other industry. And the median inventory turnover is 14 days for Real Estate industry.
7/21
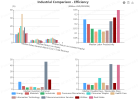
Industrial Comparison - Efficiency China-2019
8
Similar to US 2019's comparison this slide shows all the Level 1 industry group comparison for China-2019. The bottom left graph shows that Real Estate in China has the lowest inventory turns of 0.27 days, which is followed by Health care, consumer stable, industrials, IT, and so on. Also, the return on assets and median return on invested capital is lowest in case of Real Estate industry for the year 2019. Similarly, Labour productivity and Median payable Days/ receivable is also high in case of Real Estate industry compared to other industry. In China inventory Turnover is highest for Telecommunication Services.
8/21
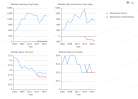
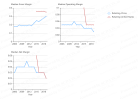
Industrial Trend - Efficiency- Real Estate- China Vs. USA- 2019
9
Comparing US and Chain's Real Estate industry, is shows that China's Real Estate industry carries a lot of inventory as compared to US as depicted on the top left graph. Similarly, the cash conversion cycle is also very high which typically takes around 500-600 days, i.e almost 2 years shown in top right graph, whereas US's cash conversion cycle is in negative.
We can see on the bottom graph that the asset turnover and return on Assets of China and US Real Estate industry is comparable.
9/21
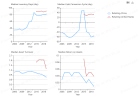
Industrial Trend - Efficiency- Retailing China Vs. USA - 2019
10
Comparing US and Chain's Retailing industry, it shows that US's Retailing industry carries more inventory as compared to China's as depicted on the top left graph. Similarly, the cash conversion cycle is also very high which typically takes around 35 days for US's retailing industry, whereas China's cash conversion cycle is in negative over the past 5years, as shown in top right graph.
We can see on the bottom graph that both the asset turnover and return on Assets of US is comparably high compared to China's Retailing industry.
10/21
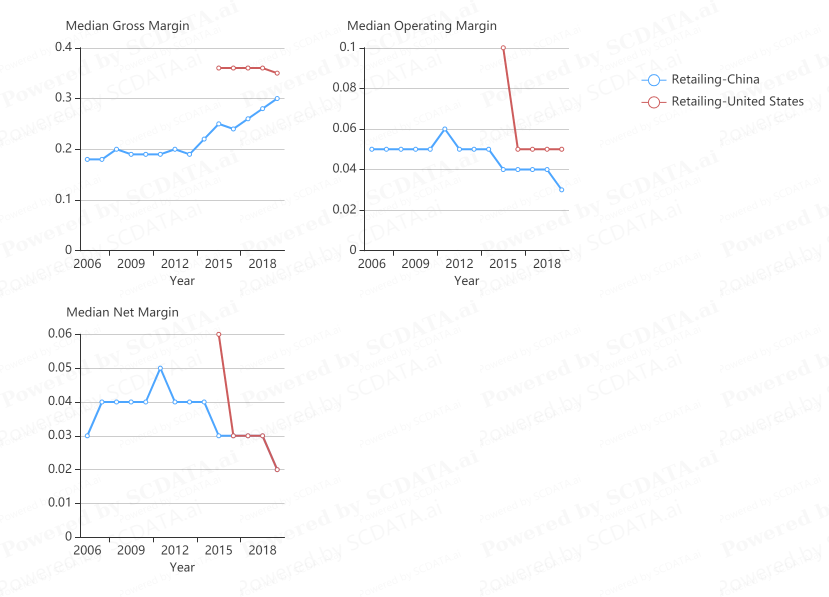
Industrial Trend - Profitability- Retailing China Vs. USA 2019
11
Analysing the Profitability Trend of Retailing industry we can see that both Gross Margin and Operating Margin are high for US's retailing industry compared to China's Retailing industry, however, Median Net Margin is same for both Nation for the year 2019.
11/21
Value Driver Analysis- Return on Assets vs. Inventory Turnover
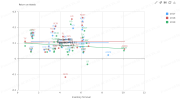
13
For SP500 companies of USA, We can say that when inventory Turnover increases there is slight reduction in Return on Assets.
13/21
Value Driver Analysis- Gross Margin vs. Inventory Turnover
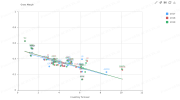
14
We choose SP500 companies of USA to analyse the Inventory Turnover (Shown in X-axis), and Gross Margin (shown in Y-axis). The analysis shows that when the inventory Turnover increases the Gross Margin decreases. The reason behind it may be : (a) higher cost of goods sold for the product , (b) loss of economics of scale due to buying small quantities frequently.
14/21
Value Driver Analysis- Assets Turnover vs. Inventory Turnover for Retailing and Consumer Durables & Apparel
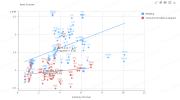
15
Here we have examined the Assets Turnover and Inventory Turnover for two industries, Retailing and Consumer Durables & Apparel. We can see that the Retailing industry shows a strong positive relation with Inventory Turnover and Assets Turnover, when Inventory Turnover increases the Assets Turnover also increases. However, that is also true that Consumer Durables & Apparel, also has a positive relation with Inventory Turnover and assets turnover but its quantity and relation is not as strong compare to the Retailing industry.
15/21
Enterprise Comparison - Size
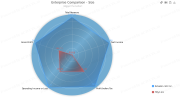
16
Here, we have examined two companies Amazon.com Inc and Tilly's Inc. As we can see that Amazon way beyond comparison with Tilly's Inc. in size. All the factor like Profit, operating income, and total revenue all are high for Amazon.
16/21
Enterprise Ranking - Inventory Days
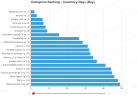
17
This slide represents the inventory days of various Companies. We can observe that Amazon's Inventory days is about 37 days which is better than that of Tilly's which is about 48 days.
17/21
Enterprise Comparison - Efficiency
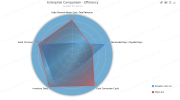
18
Comparing the Efficiency of Amazon.com Inc and Tilly's Inc. Amazon's performance is better compared to other company. Cash conversion Cycle of Amazon is also better. Tilly's Inc. seems to have higher Assets Turnover compared to Amazon.
18/21
Enterprise Trend - Efficiency
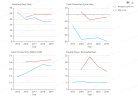
19
Amazon's Cash Conversion cycle is faster payables are also faster. But Tilly's seems to effectively utilize its labour so have labour productivity is higher compared to Amazon's.
19/21
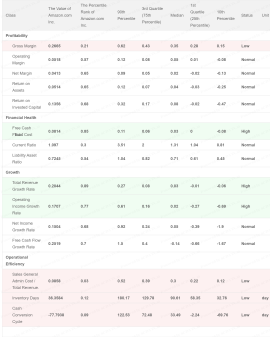
KPI Examination-Amazon.com Inc.
20
However, Amazon's Gross Margin is low but its Net Margin and Returns on Assets and invested capital are better and Normal. Moreover, Amazon holds Free Cash  as well, and  also the growth seems good.
Looking at the Operational Efficiency Amazon's Cash conversion Cycle is negative 77.79 days, where the median is 33.49 days. Similarly, Inventory days are also less than the Median of 90.61 days, and costs are also less than the Median range.
20/21
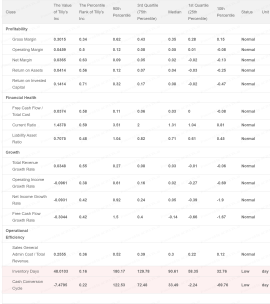
KPI Examination- Tilly's Inc.
21
Well Tilly's Inc. also seems performing good with within ranges of Median and performing as Normal. But Amazon's business size and capacity has outperform the Tilly's performance.
21/21