Abstract:
To understand the pattern of rise of Tesla among automobile giants.
Competitive Analysis
Company: Tesla Inc
Industry: Automobile
By Digvijay Singh Rathore
1
1/55
Enterprise Ranking - Total Revenue
2
1) The share value didn't peak till early 2020. The data provided, till 2019, is limited.
2) Irrespective of steep growth curve in 2019, Tesla formed customer base.
3) Made place in top 3 by strategically choosing a targeted customer section.
2/55
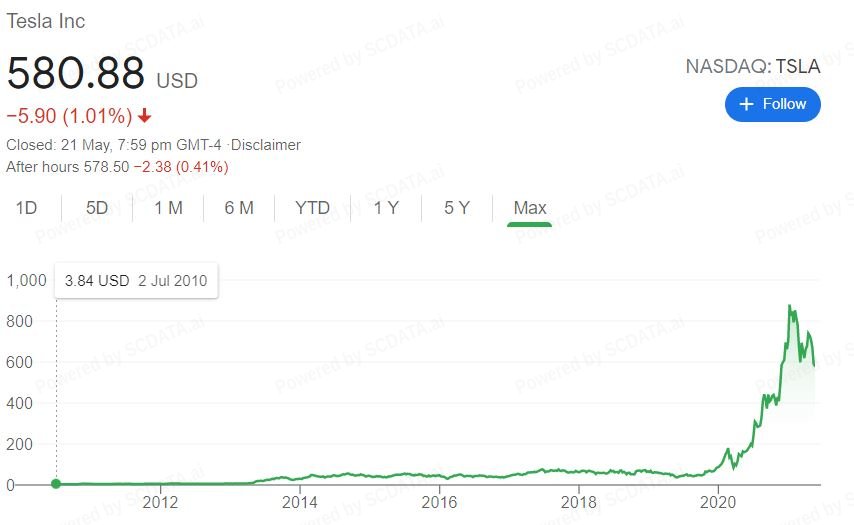
Share price pattern
3
3/55
Comments:
1) The share value didn't peak till early 2020. The data provided, till 2019, is limited.
2) Irrespective of steep growth curve in 2019, Tesla formed customer base.
3) Made place in top 3 by strategically choosing a targeted customer section.
Why Tesla?
1) Competitive analysis of Tesla will make me understand the upcoming challenges and rise of new giant in automobile sector.
4
4/55
Industry analysis for "Automobile Industry"
Company in Focus: Tesla Inc
By Digvijay Singh Rathore
Week 2 Assignment
5
5/55
Enterprise Distribution
6
Notes:
1) Michigan has highest number of enterprises in US in this industry and others have relatively lower.
2) More enterprises in Michigan => Higher Total Revenue, High Operating Income.
3) Oregon has highest total revenue growth rate. Can grow as future industry hub.
6/55
Enterprise Distribution Analysis: Key observations
1) Michigan has highest number of enterprises in US in this industry and others have relatively lower.
2) More enterprises in Michigan => Higher Total Revenue, High Operating Income.
3) Oregon has highest total revenue growth rate. Can grow as future industry hub.
7
7/55
Typical Firm Performance by Region - Profit Distribution
8
Notes:
1) Companies in Illinois are much bigger than anywhere else.
2) Although Michigan had highest number of companies but they turn out to be not the biggest in terms of Median revenue.
3) Illinois has just 1 company, so it must be the biggest one i.e. Ford Motors.
8/55
Typical firm Performance by Region
Observations:
1) Companies in Illinois are much bigger than anywhere else.
2) Although Michigan had highest number of companies but they turn out to be not the biggest in terms of Median revenue.
3) Illinois has just 1 company, so it must be the biggest one i.e. Ford Motors.
9
9/55
Concentration and Competition Intensity - Total Revenue
10
Notes:
1) Ford and GM enjoy monopoly as they have huge share in total revenue of industry.
2) Over the years, other companies have increased their percentage share.
10/55
11
11/55
Concentration and Competition Intensity - Four-firm Concentration Ratio
12
1) CR4 shows China provides more space for new entrant to grow and rise wrt US.
2) Chinese industry has higher competitor intensity.
12/55
Concentration and Competition Intensity
Observations:
Total revenue
1) Ford and GM enjoy monopoly as they have huge share in total revenue of industry.
2) Over the years, other companies have increased their percentage share.
CR4
1) CR4 shows China provides more space for new entrant to grow and rise wrt US.
2) Chinese industry has higher competitor intensity.
13
13/55
Industry Trend Analysis
By Digvijay Singh Rathore
14
14/55
Industrial Trend - Industry Total Size
15
1) US leads in total revenue but lags behind China in Total operating Income and Percentage of profitable enterprises.
2) US companies are generating more revenue with less operating cost.
15/55
Industrial Trend - Profitability
16
1) Typical company performance is going down both in US and China => Indicates more challenging situation in recent years to make profit.
2) Chinese companies have better profitability.
16/55
Industrial Trend - Efficiency
17
US has much higher Asset turnover wrt China => US has better utilization of their assets such as vehicles and facilities. Also, US has lower Inventory days.
17/55
Industrial Trend - Financial Health
18
1) China has similar Current Ratio but better L-A ratio than US. The lower the debt to asset ratio, the less risky the company.  Also, total cash flow is similar in Automobile industry for both in recent years.
2) Both US and China have current ratio >1.
A company with a current ratio less than 1.0 does not, in many cases, have the capital on hand to meet its short-term obligations if they were all due at once, while a current ratio greater than one indicates the company has the financial resources to remain solvent in the short term.
18/55
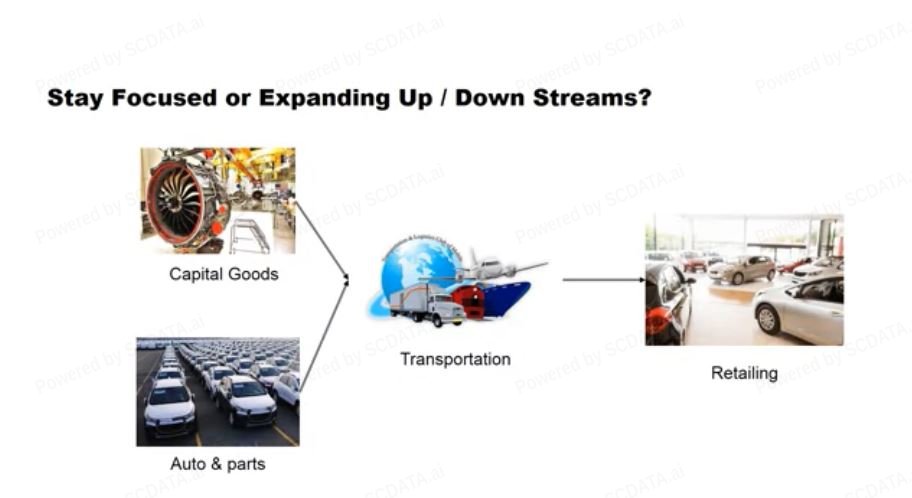
Value chain analysis
Stay focused or expand the business up and downstream?
By using Industry Comparison under Industry Analysis.
Using this tool, you can compare multiple industries
side by side on the key performance indicators.
By Digvijay Singh Rathore
19
19/55
20
20/55
Industrial Comparison - Profitability
21
Retailing and Capital goods has higher total revenue whereas Transportation has highest median revenue. Also, net margin is quite similar for all but break even probability for other 4 is better than Automobile industry.
21/55
Industrial Comparison - Growth
22
Capital goods, Transportation and Retailing has healthy growth rate in med. revenue and only Retailing has in operating income.
Auto industry has big decline in operating income growth rate.
22/55
Industrial Comparison - Efficiency
23
Transportation has the lowest med. SGA costs/ Total Revenue and good return on assets.
Retailing has Med. payable days/receivable days ratio of 8 => much higher bargaining power, good return on asset and labor prod.
23/55
Competition positioning I
Where does a company stands in the competitive landscape?
By Digvijay Singh Rathore
24
24/55
Revenue vs. Cost:
25
25/55
Revenue vs. Cost
26
26/55
Profit vs. Cost - Operating Income
27
GM is way above regression line => It is highly profitable
F is way below regression line => It is not very profitable
GM has much higher operating income than F with less cost=> Quite profitable.
LEA and BWA are smaller in size but above the line.

The Chinese counterparts have steeper slope of line wrt to US =>  the US companies have a scaling problem, that is, as they ramp up their cost, their profits increased at a slower rate than the Chinese companies.
27/55
Profit vs. Cost - Operating Income
28
28/55
Profit vs. Total Assets - Operating Income
29
F has largest asset set but does not utilize them effectively.
With the same assets, the Chinese companies are making more profits, and as they ramped up their assets, their profits were increasing at a higher rate than the American companies.
29/55
Profit vs. Total Assets - Operating Income
30
30/55
Competition Positioning II
Profit Frontier, Risk vs Return
By Digvijay Singh Rathore
31
31/55
Operating Margin vs. Revenue
32
Operating Margins of these US companies are nearly same.
32/55
Return on Assets vs. Liability Asset Ratio
33
Profitability and Financial health of US Automobile industry appears very bad. Majority companies have very low ROA and high LAR. Tesla Inc has negative ROA and very high LAR.
33/55
Competition Positioning III
34
34/55
Enterprise Ranking - Total Revenue
35
Tesla Inc is (3)
35/55
Enterprise Ranking - Operating Margin
36
Tesla Inc ranks 28
36/55
Enterprise Ranking - Return on Assets
37
Tesla Inc ranks 26
37/55
KPI Distribution by Industry
38
Majority of the companies have total revenue below 20,000 Million USD with only three big players i.e. Ford, GM and Tesla
38/55
Competitive strength and Weakness
39
39/55
Enterprise Comparison - Size
40
Ford is biggest company in Total Revenue and Gross profit whereas GM leads in other 3 areas. Our company in focus, Tesla Inc, is below average performer
40/55
Enterprise Comparison - Profitability
41
Harley is the biggest player in profitability but Tesla also performs decent wrt to its competitors.
41/55
Enterprise Comparison - Return on Investment
42
Adomani Inc is the weakest among these. These observations are consistent with the stock prices (2019)
42/55
Enterprise Comparison - Key Indicators
43
Tesla Inc is average performer in profitability, gross margin an current ratio.
43/55
KPI Examination: Similar to the physical examination of a person, the KPI examination of a company checks the health of the company and detects early signals for problems and opportunities.
44
44/55
Enterprise Diagnosis II
Trend of competing enterprises
By Digvijay Singh Rathore
45
45/55
Enterprise Trend - Market Share
46
Total revenue of Tesla inc is on increasing trend whereas Ford and GM have slight downfall.
Op Income has been falling sharply for Ford
46/55
Enterprise Trend - Profitability
47
Margins have remained almost stagnant in the industry with minor lower trend in Gross margin. Adomani Inc has improved it's profitability in recent years.
47/55
Enterprise Trend - Financial Health
48
Current Ratios are greater than 1 showing ease of paying short term debts in industry. Also, LA ratios are high but stagnant.
Tesla Inc has LTDR on lower side wrt to others.
48/55
Enterprise Trend - Efficiency
49
Tesla has poor labor productivity, lowest in recent years. But, has amazing bargaining power over its suppliers and customers with highest payable over receivable days ratio.
49/55
Value Driver and Breakdown Analysis
By Digvijay Singh Rathore
50
50/55
Value Driver Analysis
51
As shown by the picture, a higher liability asset ratio(X) may lead to a lower operating margin(Y) for the years from 2015 to 2018. One explanation is that, a higher liability asset ratio may incur a higher other cost in the income statement, which can reduce the operating margin.
The Equation of the line also suggests y proportional to -x
51/55
Value Driver Analysis
52
The liability asset ratio may affect the return on assets. As shown by this picture, a higher liability asset ratio may drive down the return on assets.
52/55
Using this tool, you can break down the revenue and assets of a company, and compare them to industry averages to detect abnormalities.
53
Tesla's COGS ~ Industry Average but other costs are much bigger and thus leading to poor net income wrt others.
53/55
Enterprise Breakdown - Liability-Equity
54
Tesla and GM have similar profiles as industry average. Ford has least equity among these 3.
54/55
Enterprise Breakdown - Detailed Assets
55
We can see Tesla is falling extremely short on net receivables but the good news is it has lot of cash! Much higher than industry average. Also, it has larger inventory and Property plant suggesting a lot of scope for growth in future.


