Benchmark by KPI - Inventory / Total Assets

3
In the United States, the inventory of Consumer Staples and Consumer Discretionary accounts for the largest proportion of total assets, followed by materials and information technology industries. While the ratio of remaining financial services, communication services and utilities is not high.
3/83
Benchmark by KPI - Inventory / Total Assets

4
I choose Capital Goods and Technology Hardware & Equiprment as the two industies to analysis, and the level 1 iare Industrials and Information Technology. Thus, the page is Industrials and Information Technology's Level-2 Industrials in US. Among the six industries's median Inventory / Total Assets, Technology Hardware & Equipment and Capital Goods occupy the first and second with 0.14 and 0.11 respectively, followed by Semiconductors and Semiconductor equipment. The ratio is 0.04 for Commerical & Professional Services and the ratio is 0.01 for both Software & Services and Transportation.
4/83
Benchmark by KPI - Inventory / Total Assets

5
The situation in China is similar to that in the United States. The page is Industrials and Information Technology's Level-2 Industrials in China. Among the six industries's median Inventory / Total Assets, Technology Hardware & Equipment and Capital Goods still occupy the top 2, but they do not differ in the median in China. Inventory in assets is low in service-related industries, such as Commerical & Professional Services, Software & Services, and Transportation.
5/83
Technology Hardware & Equipment Trend - Efficiency

6
Except for 2015, inventory days in the U.S. and China maintained the same trend in all years. Inventory days, which are higher in China than in the U.S. prove that the Chinese companies involved need to keep longer inventories of hardware equipment and are less efficient than U.S. companies. The shorter the cash conversion cycle, the better. The U.S. has fewer CCCs than China, so U.S. companies have faster cash turns. However, the U.S. CCC growth in 2020 is close to China's. U.S. firms have higher asset turnover rates, indicating that U.S. firms utilize assets more quickly and efficiently to move from input to output. China is better than the U.S. in ROA. The ROA of Chinese companies has always remained around 0.04 to 0.05. While US companies have a more volatile ROA and even a negative ROA in 2018 and 2019. Chinese companies have a better ability to generate turnover from their assets than U.S. companies.
6/83
Capital Goods Trend - Efficiency

7
Capital Goods industry is very different from Technology Hardware & Equipment. U.S. firms still have higher asset turnover rates, indicating that U.S. firms utilize assets more quickly and efficiently to move from input to output. Finally, U.S. firms' ROA fluctuates more sharply than China's, but the difference in ROA between the two countries is smaller. In recent years, the ability of firms in both countries to utilize assets has been similar, but there has been a downward trend in the U.S.
7/83
Capital Goods Trend - Profitability

8
In the Capital Goods industry, the difference between the U.S. and China is smaller in total interest rates and operating margins, but net interest rates are nearly twice as high in China as in the U.S., indicating that U.S. companies spend more on non-operating and other activities.
8/83
Technology Hardware & Equipment Trend - Profitability

9
In the Technology Hardware & Equipment industry, the gap between Chinese and American companies is bigger than capital goods. The total profit margin in the U.S. is higher than that in China, yet the operating margin is lower than that in China, indicating that U.S. companies spend less on product costs and more on daily operations. The U.S. net profit margin is not promising, hovering around 0, while China's is higher than 0.06, probably because the U.S. spends on non-operating activities, such as taxes. Overall, U.S. companies are less profitable than China.
9/83
Industrial Comparison - Profitability

10
During the class, Professor Zhao analyzed the industry of Level-1, and I choose industrial and IT-related Level-2 industries to analysis. Among the six industries, the semiconductor industry has the highest operating profit margin as well as net profit margin, followed by capital goods. The operating margin as well as the net profit margin for software and services are both negative, indicating the profitability of the industry.
10/83
Industrial Comparison - Efficiency China

11
In China, the inventory turnover rate of transportation is high, but due to the industry-specific attributes is a high inventory turnover rate is normal. The labor productivity is much lower compared to the Level-1 industries that Professor Zhao compared in class. Days Payable is higher than Days Receivable in all six industries, which proves that these industries have good debt turnover.
11/83
Industrial Comparison - Efficiency U.S.

12
In the U.S., in addition to high inventory turnover in Transportation, Software & Services also have higher turnover rates. Labor productivity is also much lower compared to the Level-1 industries that Professor Zhao compared in class. All six industries have higher days payable than days receivable, with software and services having the best debt turnover. The return on investment for these six industries in the U.S. is lower than in China, with the Software & Services industry having a negative return on assets, evidence of negative net profits and a weaker ability to use assets to generate profits.
12/83
Value Driver Analysis US Capital Goods Gross Margin

14
Due to the large sample size, the total profitability of most firms with capital goods is concentrated in six inventory turns a year. However, from the straight line formed by the function, we can determine that the total profitability is related to the inventory turnover. As the inventory turnover increases, the total profitability decreases.
14/83
Value Driver Analysis US Capital Goods Net Margin

15
The relationship between net profit margin and inventory turnover is weaker than that of total profit margin. As inventory turnover increases, net profit margin decreases, but by a small amount.
15/83
Value Driver Analysis US Capital Goods Payable Days / Receivable Days

16
Although the data volume remains large, the correlation coefficient is not zero this time, indicating a strong relationship between inventory turnover and Payable Days / Receivable Days. With the increase in inventory, Payable Days / Receivable Days derease. Faster inventory turnover, faster receipt of goods by buyers, and thus faster payment shortens receivable days.
16/83
Value Driver Analysis US Capital Goods Asset turnover

17
Asset turnover and inventory turnover are positively correlated. As inventory turnover increases, asset turnover increases and is greater. Inventory is a part of assets, and as inventory turns quickly, the turnover of assets related to, for example, accounts receivable also becomes faster.
17/83
Value Driver Analysis China Technology Hardware & Equiprment Gross Margin

18
The number of Technology Hardware & Equiprment companies in China is even greater than in the United States, so the relationship is not obvious. As inventory turns increase, there is a slight decrease in gross margin, which is more pronounced in 2018.
18/83
Value Driver Analysis China Technology Hardware & Equiprment Net Margin

19
From the graph, the straight line formed by net margin and inventory turnover is extremely flat and the correlation coefficient is 0. Therefore, the correlation between inventory turnover and net profit margin is extremely weak in Technology Hardware & Equiprment, China.
19/83
Value Driver Analysis China Technology Hardware & Equiprment Payable Days / Receivable Days

20
In 2019, there is a strong linear relationship between Payable Days / Receivable Days and inventory turns for Chinese companies, i.e. Payable Days / Receivable Days increases rapidly with the increase in inventory turns. In 2018 and 2020, the trend of this increase is very flat. Unlike Payable Days / Receivable Days in the U.S., which increase with inventory turnover, the possible reason for this change in China is that there is not a strong link between collections and payments and deliveries.
20/83
Value Driver Analysis China Technology Hardware & Equiprment Gross Margin

21
In 2018, inventory turnover has a significant positive relationship with asset turnover, probably because inventory itself is an asset and the turnover of inventory drives the turnover of assets. However, in 2019 and 2020, this relationship does not manifest itself.
21/83
Benchmark by KPI - Inventory Days China

23
By comparing the median inventory days of Industrials and Information Technology's Level-2 Industrials in China, capital goods have the highest inventory days, followed by Semiconductors & Semiconductors Equipment and Technology Hardware & Equipment, respectively. I find that the service related industries will have less inventory, for example, the remaining three industries in the table are related to services, including the transportation industry due to its own characteristics therefore less inventory days.
23/83
Enterprise Ranking - Inventory Days China Technology Hardware & Equipment

24
The top 20 companies with the least inventory in the Technology Hardware & Equipment industry in China are shown in the chart. Among the types of companies, limited companies are the most numerous. Gome Communication Equipment, which I will analyze, ranks third, and ZTE Corporation is not on the list.
24/83
Enterprise Comparison - Efficiency

25
The two companies I chose were ZTE and Gome, two of the more famous companies in China. The two companies are similar in Sales General Admin Cost / Total Revenue, which proves that both companies have similar sales management capabilities. Gome is better than ZTE in terms of liquidity and flexibility, as evidenced by its higher asset turnover, shorter inventory days and cash conversion cycle, which indicates that Gome's assets, cash and inventory are more quickly converted and more flexible. However, ZTE's days receivable/days payable are lower than Gomez's, meaning that ZTE is able to collect more quickly from its customers and has a better ability to balance receivables and payables.
25/83
Enterprise Comparison - Size

26
In terms of corporate scale, ZTE greatly exceeds Gome on all fronts, including total revenue, gross profit, net incme,profit before tax, and operating income or loss. .In terms of the nature of the enterprise, Gome belongs to the private sector, while ZTE belongs to the public-private partnership of state-owned enterprises. The nature of the enterprise also partly reflects the reasonableness of the scale, because the government will give more support to state-owned enterprises to help the company develop.
26/83
Enterprise Trend - Efficiency

27
ZTE has significantly more days of inventory than Gomez, which has a much faster and more efficient inventory flow. It is worth noting that both companies have a negative cash conversion cycle, proving that both companies are able to move cash quickly and may have early payments such as bookings. ZTE's labor productivity is higher than Gome's, indicating that each employee at ZTE can create more value for the company. ZTE's days receivable/days payable are lower than Gomez's, meaning that ZTE is able to collect more quickly from its customers and has a better ability to balance receivables and payables.
27/83
KPI Examination Gome

28
Gome's profitability in the industry is low, with low margins in all categories. low ROA and Return on Invested Captial are evidence of Gome's ability to generate returns on assets and capital. Gome's current ratio also does not perform very well, indicating that current assets provide little protection for current liabilities. Gome's high gearing ratio indicates that Gome has a high level of debt. Gome's high revenue growth rate proves that the company is in a good position to grow. In addition, Gome's inventory days and cash conversion cycle are both lower than the industry, indicating that Gome has better liquidity.
28/83
KPI Examination ZTE

29
ZTE's gearing is also higher, but lower than Gomez's, indicating that ZTE's liabilities account for fewer assets than Gome's. ZTE's Free Cash Flow Growth Rate is high, ZTE's liquid cash has a growing trend, which ZTE can use the cash for project development. ZTE needs to improve in inventory days and needs to communicate better with customers to get inventory delivered faster. Similar to Gome, ZTE's cash conversion cycle is shorter, indicating the period from cash paid for inventory to cash recovered, so ZTE is able to recover cash more quickly.
29/83
Enterprise Distribution Consumer Staple

35
In US, California has the most Household & Personal Products enterprises, the second is New York, followed by Florida.
35/83
Typical Firm Performance by Region - Profit Distribution

36
In the United States, the distribution of businesses and total profits do not match well. The largest revenue is in Ohio. Of the three states with the most businesses, New York had the most total revenue, followed by California and finally Florida.
36/83
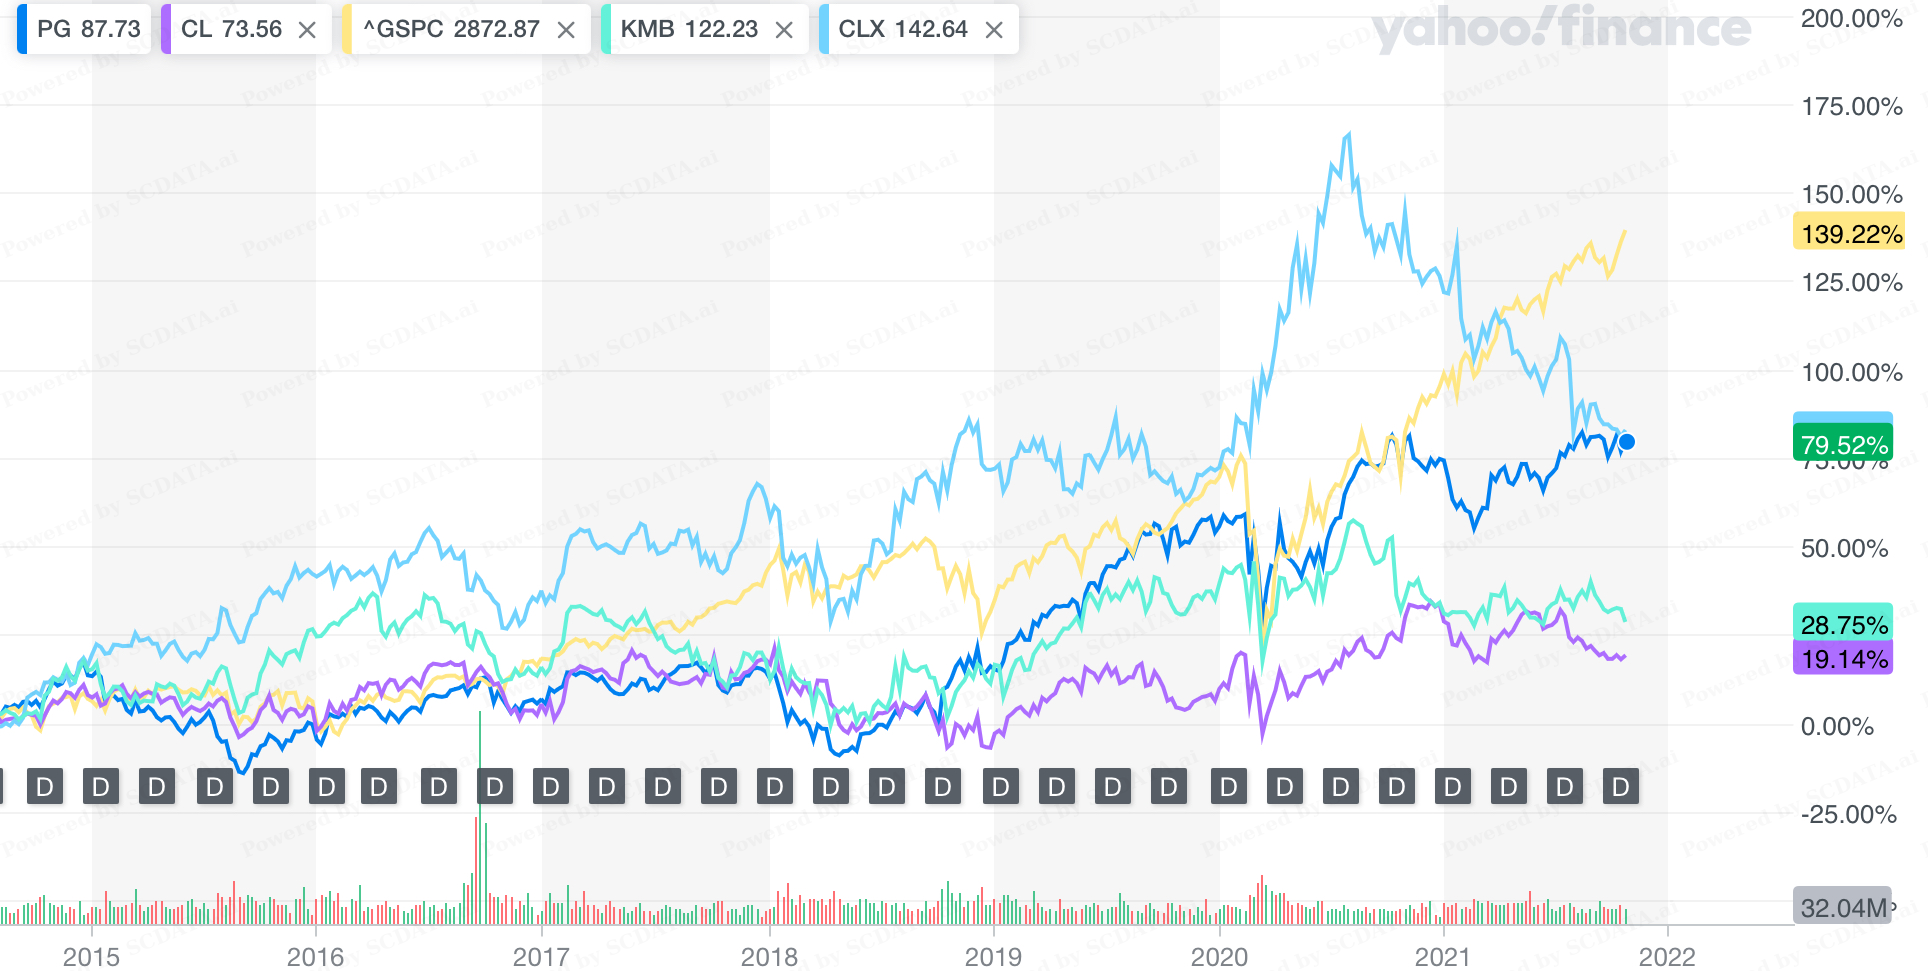
Concentration and Competition Intensity - Total Revenue

37
US Household & Personal Products industry is almost generally dominated by P&G. Kimberly-clark, Colgate-Palmolive, and Estee Lauder -- these are big companies that each have a share of the industry.
37/83
Concentration and Competition Intensity - Four-firm Concentration Ratio

38
US may have more opportunity and higher competition intensity than China. China is more monopolized.
38/83
Industrial Trend - Industry Total Size

40
The U.S. far exceeds China in total revenue,operating income, and net income. However, the percentage of profitable companies in the U.S. is much lower than in China. The reason may be that most of the U.S. companies are international companies that have a huge share of the world.
40/83
Industrial Trend - Profitability

41
China's profitability is better than that of the United States. In Gross margin, the gap between China and the U.S. is smaller, with China slowly increasing year by year and the U.S. slowly decreasing year by year.The operating and net profit margins, which have remained flat year by year in China and declined significantly in the U.S., even negative for many years, had a slight increase in 2020.
41/83
Industrial Trend - Efficiency

42
US vs China, 2020, Household & Personal Products, efficiency. Us has a higher inventory days and lower Assets Turnover and ROA, but a shorter cash cycle than China, so China has a better asset utilization.
42/83
Industrial Trend - Financial Health

43
US vs China, 2020, Household & Personal Products, financial health. China has a better current ratio and liability asset ratio,and much larger and have much more operating cash and total cash. China is financially healthier than the US.
43/83
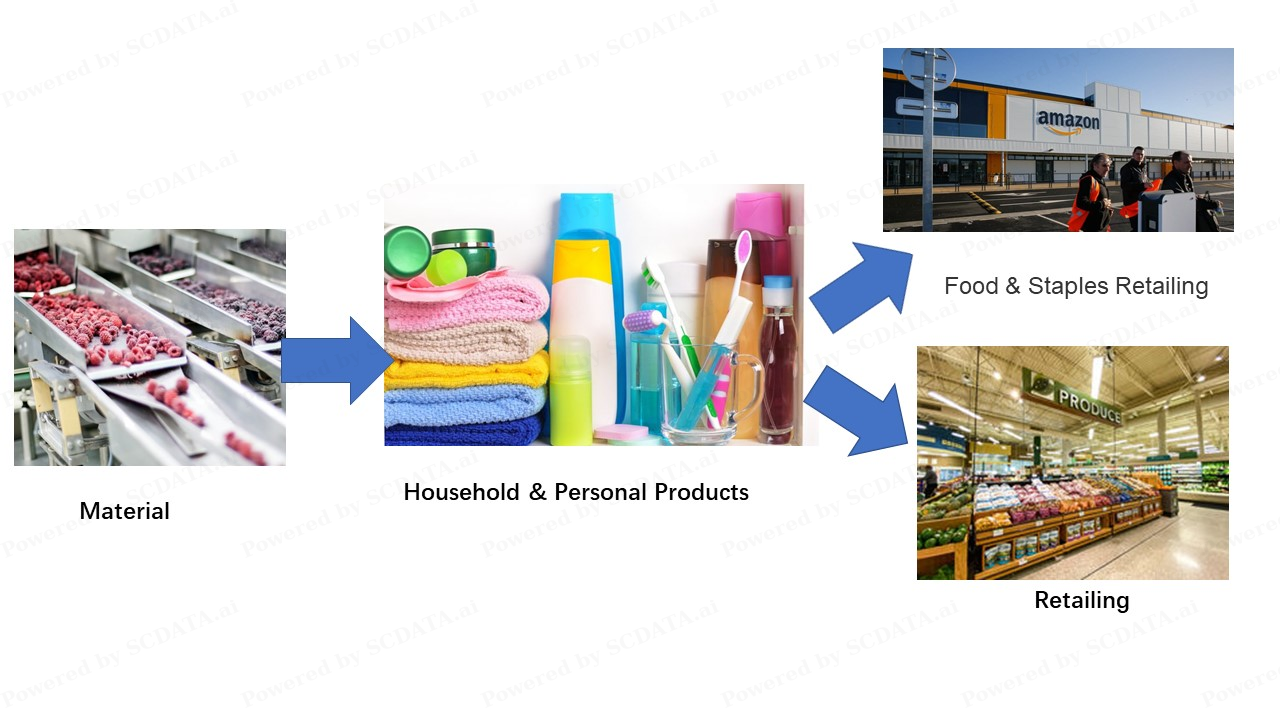
Industrial Comparison - Profitability

46
(SP500) Of these four industries, Food & Staples Retailing is the largest, but less profitable than the other three. Household & Personal Products is the smallest but the most profitable.
46/83
Industrial Comparison - Profitability

47
The non-SP500 companies have a very different side. Of these four industries, food and staple retailing is the smallest, but less profitable than the other three.
47/83
Industrial Comparison - Growth

48
The materials industry is performing very poorly on total & Median. The remaining three industries have a good growth.
48/83
Industrial Comparison - Efficiency

49
Household & Personal Products has the high admin cost/ total revenue, but low ROA. Moreover, Household & Personal Products industry has low Inventory turnover, and low labor producitivity.
49/83
Revenue vs. Cost Total Revenue

51
In the Household & Personal Products industry, China is much smaller than the United States. P&G in the U.S. is the largest company, followed by Kimberly-Clark in the analysis, whose total revenue is slightly below average. Colgate and Clorox are basically on the average.
51/83
Profit vs. Cost - Operating Income

52
Colgate's operating income was slightly above the industry average. P&G maintained its large scale and high profitability, while Clorox and Kimberly-Clark performed slightly below the industry average.
52/83
Profit vs. Total Assets - Operating Income

53
Colgate has fewer assets and is more profitable than Kimberly-Clark. P&G's revenue and assets far exceed those of other companies in the industry.
53/83
Operating Margin vs. Revenue

55
Colgate's profitability is above profit frontier. Kimberly-Clark and Clorox are less profitable. P&G can maintain the highest profit margins in the industry while ensuring high scale.
55/83
Return on Assets vs. Liability Asset Ratio

56
Colgate's ROA is good, but its financial health is not. Kimberley performs better on ROA, but has the largest debt assets of the five, proving that the business has a high level of debt. P&G's financials are healthy but ROA is not high, Clorox is not doing well in both financial health and ROA.(SP500 is used for ease of observation due to the large and uneven distribution of all companies.)
56/83
Enterprise Ranking - Total Revenue

58
P&G came in first with far more revenue than any other competitor, followed by Kimberly-Clark in second and Colgate in third, with the fourth Clorox being about half of Colgate's revenue.
58/83
Enterprise Ranking - Gross Proft

59
P&G and Colgate are ranked fourth and fifth respectively with an operating margin of 0.24. The gap between Clorox and Kimberly is smaller, both at 0.17, tenth and eleventh respectively.
59/83
Enterprise Ranking - Return on Assets

60
Colgate-Palmolive ranks fourth with an ROA of 0.17. Kimberly-Clark is 0.13, P&G is 0.12, and Clorox 0.11.
60/83
KPI Distribution by Industry

61
Colgate's ROA of 0.17 outperforms most companies.
61/83
KPI Distribution by Industry

62
Among SP500 companies in the Household & Personal Products industry, Colgate-Palmolive's profitability(operating magin 0.24) is strong. (SP500 is used for ease of observation due to the large and uneven distribution of all companies.)
62/83
Enterprise Comparison - Size

65
In the Household & Personal Products industry, UK and US, P&G and Unilever are the first and second largest. Colgate-Palmolive and Kimberly-Clark are similar in size, and Clorox is the smallest.
65/83
Enterprise Comparison - Profitability

66
P&G's profitability is good.
66/83
Enterprise Comparison - ROI

67
Colgate-Palmolive's return on equity is lower than Kimberly-Clark's for the same size.
67/83
Enterprise Comparison -

68
Colgate-Palmolive's total revenue growth rate is 0.05, which is low among its competitors and may be a reason for the lower share price. In addition, Colgate-Palmolive has the lowest inventory turnover rate among its competitors and lacks liquidity. In addition, Colgate-Palmolive has only a little more assets than liabilities and is over-indebted.
68/83
KPI Examination

69
Within the industry as a whole, Colgate-Palmolive has superior profitability and other usual performance, but the industry includes many small loss-making companies. Among companies in the same tier as Colgate-Palmolive, Colgate-Palmolive is underperforming in terms of growth and operating efficiency and theliability weighting in financials.
69/83
Enterprise Trend - Size

71
Among its competitors, Colgate-Palmolive has maintained its fourth position in total revenue. Operating revenues have remained in the third position.
71/83
Enterprise Trend - Profitability

72
In the Household & Personal Products industry, Colgate-Palmolive is in a very good position for profitability.
72/83
Enterprise Trend - Financial Health

73
Colgate-Palmolive's high long-term debt to equity ratio is evidence that Colgate-Palmolive is not financially healthy, which may explain the low stock price.
73/83
Enterprise Trend - Efficiency

74
Colgate-Palmolive has much higher inventory days than other competitive companies in the industry, poor inventory liquidity but Colgate has a shorter cash conversion cycle. In addition, Colgate's labor productivity is lower than P&G and Clorox.
74/83
Value Driver Analysis

76
A higher liability asset ratio may lead to a lower operating margin(2018, 2019, and 2020, SP500only).
76/83
Value Driver Analysis

77
Among Household & Personal Products industry, a higher liability asset ratio may lead to a lower operating margin.
77/83
Value Driver Analysis

78
A higher liability asset ratio may lead to a higher ROA (SP500only).
78/83
Value Driver Analysis

79
A higher liability asset ratio may lead to a lower ROA.
79/83
Enterprise Breakdown - Revenue

80
Colgate-Palmolive's SG&A Expenses and COGS are lower than the industry average. Net income is above average but income taxes are above average.
80/83
Enterprise Breakdown - Revenue

81
Colgate-Palmolive's debt position is poor. Colgate's total shareholder equity is well below the industry average, but both current and non-current liability are above average.
81/83
Enterprise Breakdown - Revenue

82
Colgate-Palmolive has less cash than the industry average and higher inventory and net receivables than the industry average.
82/83


