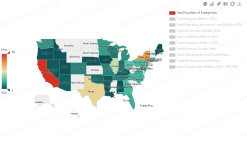
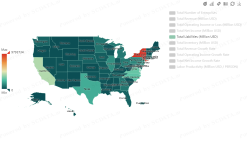
# of SP500 firms by state
7
California, New York, Texas and Illinois have the most SP500 firms! Most prosperous regions in the US.
7/51
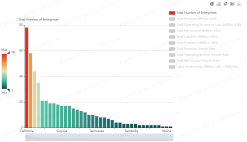
# of SP500 firms by state - bar chart
8
You can use the bar chart to show the same information in a different way.
8/51
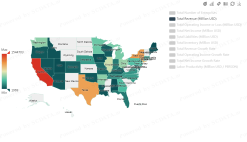
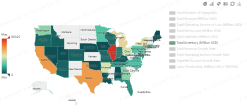
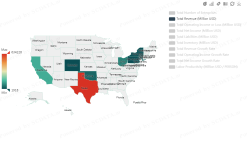
Total revenue by state
9
California, New York, Texas and Illinois also have the highest revenue! Lots of money there
9/51
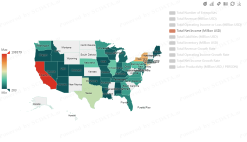
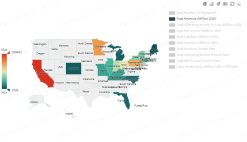
Net income by state
10
California, New York, Texas and Illinois have the highest net income ($)! So likely a higher salary & bonus
10/51
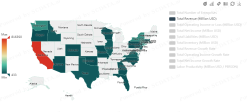
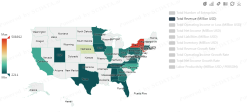
Liabilities / risk by state
11
New York has the highest liabilities / risk although it hasn’t the highest revenue / operating profit. CA’s risk is much lower than NY – higher paid & better job security?
11/51
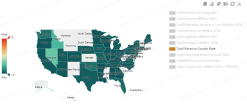
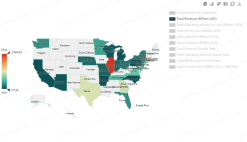
Total inventory by state
12
Illinois is the country’s warehouse and logistics center with the highest inventory for enterprises headquartered there. CA, TX are lower than IL, and NY is much lower.
12/51
Revenue growth rate by state
13
Regions with the highest revenue or profit were not necessarily growing the fastest, which are Delaware, Nevada and Idaho in 2017.
13/51
Where are IT firms in the US?
15
Want to work in IT? Clearly CA! Followed by WA, NY.
15/51
Where are energy firms in the US?
16
Want to work in Energy? Clearly TX! Followed by CA, Ohio, and Oklahoma.
16/51
Where are financial firms in the US?
17
Want to work in Financials? Clearly NY! Followed by Nebraska, CA and NC.
17/51
Where are healthcare firms in the US?
18
Want to work in Healthcare? Clearly CA, followed by MN, NY, and NJ.
18/51
Where are industrials firms in the US?
19
Want to work in Industrials? Clearly IL, followed by TX, MA, and GA.
19/51
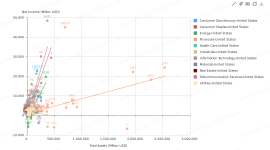
Economic Activity Level
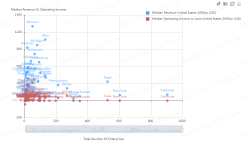
21
MI & OH have a few large companies, CA & NY have many smaller companies, TX is somewhere in the middle.
21/51
Does economic prosperity translate to job opportunities?
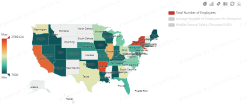
22
Largely yes! The SP500 firms headquartered in NY, CA, IL, OH, TX, NJ hire the largest number of employees. Arkansas is high due to Wal-Mart.
22/51
Revenue vs. Cost
25
Let’s first perform the revenue and cost analysis. Facebook & Dollar Tree have the same cost, $20B, Dollar Tree made $22B but
Facebook made $40B!
25/51
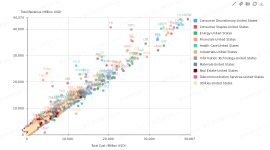
Which industry has a higher pay-off / return for a lower cost?
26
IT in USA is the most profitable sector, telecom & finance are the next, ... consumer staples, consumer discretionary and energy are the least profitable sectors in 2017. Different profitability (profit / cost ratio) for different industries! Which one to enter? IT is the best.
26/51
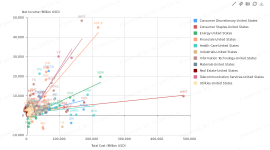
Which industry has a higher pay-off with a lower asset?
27
IT still has the highest return for the same amount of asset, consumer staple and telecom followed, financials and industrials are among the worst! Different from operating profit vs total cost.Financials and industrials are the worst performers on these metrics because of high liabilities and high investment in factories, equipment etc. Very different return (profit / asset ratio) for different industries! Which one to invest? IT is still the best.
27/51
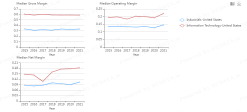
Industrials vs IT on profitability
30
IT firms are more profitable than industrials firms
30/51
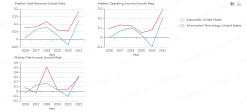
Industrial vs IT on growth
31
IT firms grow faster than industrial firms in both revenue and profits.
31/51
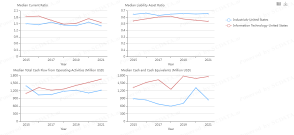
Industrial vs IT on liabilities and risk
32
IT firms have a better liquidity ratio a lower liability / asset ratio, and has more cash each year and in total
32/51
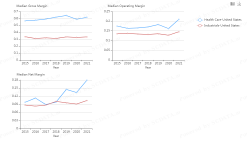
Industrials vs Healthcare on profitability
35
Healthcare firms are more profitable than industrials firms.
35/51
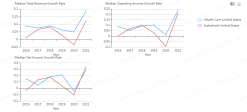
Industrials vs Healthcare on growth
36
Healthcare firms grew faster in revenue and profits than industrials firms
36/51
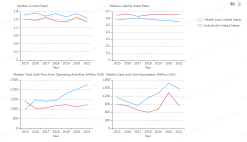
Industrials vs Healthcare on liabilities and risk
37
Healthcare firms have a better liquidity ratio, a lower liability / asset ratio, and much more cash than industrials
37/51
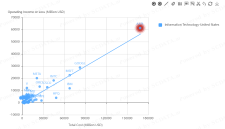
Profit vs. cost (effort) for IT industry
40
Google is just the average case! Apple and Facebook, Microsoft, Visa outperformed their peers
40/51
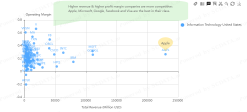
Company analysis: IT 2017 Profit frontier (Operating margin vs revenue)
41
Higher revenue & higher profit margin companies are more competitive: Apple, Microsoft, Facebook and Visa are the best in their class.
41/51
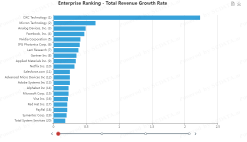
Enterprise Ranking - Total Revenue Growth Rate
42
Higher revenue & higher growth do not typically go together. In 2017, DXC, Micron, Analog, FB and Nvidia grew the fastest.
42/51
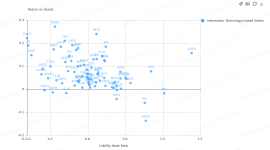
ROA vs Liability Asset ratio for IT 2017.
43
NVDA, TXN, SWKS, FB are doing great! VRSN, MSI, WU are game over. AAPL, CSCO, GOOGL are the average cases.
43/51
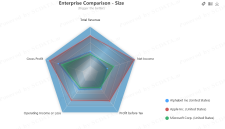
Enterprise Comparison - Size
44
Comparing Apple, Google and Microsoft side-by-side, we can see Apple has the biggest revenue and all measures of profit. Google is bigger in revenue, gross profit and operating income but Microsoft is bigger in net income - meaning the latter may has a tax advantage.
44/51
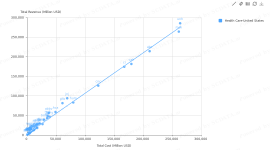
Revenue vs. Cost
46
Profit vs. cost (effort) for Healthcare industry: Pharma companies are above average! Healthcare distributors are the largest but no the most profitable ones.
46/51
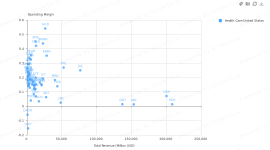
Operating Margin vs. Revenue
47
Higher revenue & higher profit margin companies are more competitive: unh, jnj, PFE and gild are the best in their class.
47/51
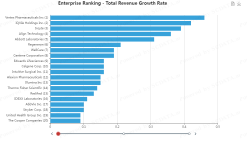
Enterprise Ranking - Total Revenue Growth Rate
48
Fastest growing companies in 2017 are: vertex, IQVIA, Incyte, Align, Abbott.
48/51
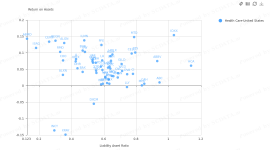
Return on Assets vs. Liability Asset Ratio
49
low risk and high return companies: ABMD, CCERN, REGN, etc. High risk and low return companies: HCA,ABC,MCK, ...
49/51


