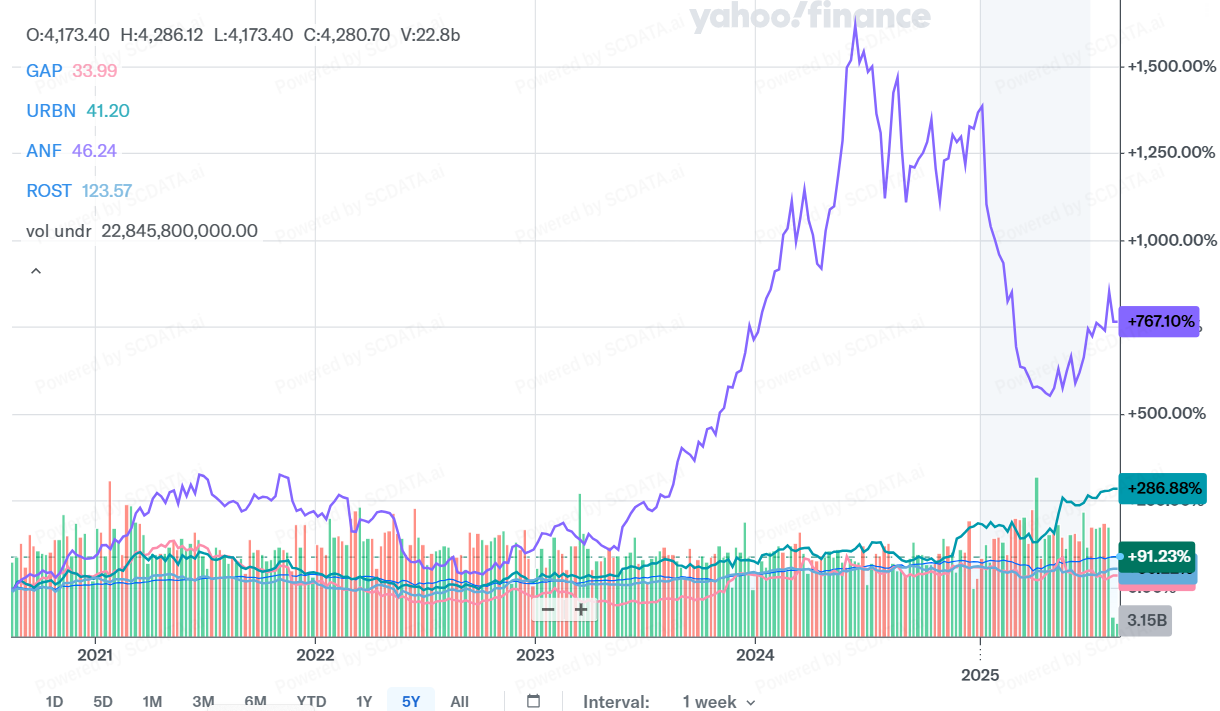
Comparison Stock Price of The GAP to Abercrombie and Fitch, Urban Outfitters and Ross Stores

4
Stock prices for the GAP have decreased or been relatively flat since 2021. Stock prices for Abercrombie and Fitch have increased most significantly but increases have also been shown for Urban Outfitters and Ross Stores. Stock prices of the other three companies are above that of the GAP.
4/49
Industrial Comparison - Efficiency

8
Sales and general administrative expenses were similar for all categories. Inventory turnover was greatest for the internet and direct marketing retail segment which is a logical finding. Labor productivity was highest for the distributor category and lowest for specialty retail and multiline retail which may be due to these categories being more customer focused thus requiring more labor. Median payable days/receivable days were highest for the multiline retail industry which means this segment has the most market power.
8/49
Industrial Trend - Industry Total Size

10
Revenue, net income and profitability were relatively stable for the distributor, multiline retail and specialty retail segments from 2016 to 2024 with the specialty retail segment exceeding the others. Revenue, net income and profitability for the internet & direct marketing segment has increased during that time period except for a sharp decline in profitability in 2022 due to inflation and higher costs associated with transportation shortages.
10/49
Profitability Distribution by Industry- Consumer Discretionary Retailing Net Margin

11
The consumer discretionary- retailing industry is a risky industry as many companies have a negative net margin or net margins that are close to zero.
11/49
Industrial Breakdown - Consumer Discretionary- Retailing Revenue

12
The percentage of cost of goods sold is high and relatively similar for all categories in the consumer discretionary- retailing category. The percentage of SG & A expenses are highest for the multiline retail and distributor categories and are lowest for the internet and direct marketing retail category. The percentage of SG & A expenses for the specialty retail category are lower than I would have expected due to the customer focus in this category.
12/49
Consumer Discretionary- Retailing Profit vs. Cost - Operating Income

13
Profit increases as costs increase for each of the segments. Profits increase more substantially for the specialty retail category than the other categories.
13/49
Concentration and Competition Intensity - Total Revenue for Consumer Discretionary-Retailing-Specialty- Apparel

15
In 2016 the retail specialty apparel category was concentrated with 5 main players, TJX companies, Ross Stores, GAP Inc, Foot Locker and L Brands, Inc. Since this time L Brands has lost a significant amount of market share and many new smaller companies have entered the market allowing for greater competition.
15/49
Concentration and Competition Intensity - Operating Income or Loss for Consumer Discretionary-Retailing-Specialty- Apparel

16
Of the 5 main players from 2016 operating income has decreased significantly for 3 of the 5 companies including Gap, Inc, Foot Locker and L Brands Inc. Ross Stores and TJ X Companies have maintained or increased their market share.
16/49
Industrial Comparison - Profitability for Consumer Discretionary-Retailing-Specialty

18
In terms of total revenue and total profitability in the retailing specialty sector, automotive retail and home improvement retail generate the most total revenue and are total operating income followed by apparel retail. Median revenue is highest for automotive retail but median operating margin, net margin and profitability are highest for home improvement retail.
18/49
Industrial Comparison - Growth for Consumer Discretionary-Retailing-Specialty

19
When evaluating total revenue growth rate, total operating income growth rate, total net income growth rate and total market cap growth rate the only category that is consistently positive is apparel retail.
19/49
Industrial Comparison - Efficiency for Consumer Discretionary-Retailing-Specialty

20
Sales and general administrative expenses are highest for home improvement retail, home furnishing retail and apparel retail. Inventory turnover is greatest for computer & electronics retail, automotive retail and apparel retail. Labor productivity was highest for automotive retail and lowest for apparel retail which may be due to this category being more customer focused thus requiring more labor. Median payable days/receivable days were highest for the home furnishing retail category, home improvement retail category and apparel retail categories which means that these segments have the most market power.
20/49
Revenue vs. Cost- Retailing-Specialty- Apparel

23
Companies of similar size to the GAP are Ross Stores, Burlington, Foot Locker, Victoria's Secret, Urban Outfitters and Abercrombie and Fitch
23/49
Profit vs. Cost - Operating Income for Retailing-Specialty-Apparel

24
Profitable companies of similar size to the GAP include Ross Stores, Abercrombie & Fitch and Urban Outfitters. Struggling companies include the GAP, Burlington, Foot Locker and Victoria's Secret.
24/49
Profit vs. Total Assets - Operating Income for Retailing-Specialty-Apparel

25
Companies of similar size to the GAP that are successfully utilizing their assets include Ross Stores, Abercrombie & Fitch and Urban Outfitters. Companies with poor asset utilization include the GAP, Burlington, Foot Locker and Victoria's Secret.
25/49
Operating Margin vs. Revenue- Retailing-Speciatly-Apparel

26
Looking at the profit frontier for the companies being focused on Abercrombie and Fitch, Urban Outfitters and Ross Stores sit at or above the profit frontier but the GAP sits below it.
26/49
Return on Assets vs. Liability Asset Ratio- Retailing- Specialty-Apparel

27
Urban Outfitters, Ross Stores and Abercrombie and Fitch have better Return on Asset/ Liability Asset Ratios than the GAP meaning that they are utilizing their assets more effectively and have less debt than the GAP
27/49
Enterprise Ranking - Total Revenue- Retailing-Specialty- Apparel

29
In terms of total revenue for the companies being studied, Ross Stores has the second highest revenue in the retailing-specialty-apparel category followed by the GAP. Urban Outfitters and Abercrombie and Fitch rank 8 and 9.
29/49
Enterprise Ranking - Operating Income or Loss- Retailing-Specialty-Apparel

30
In terms of operating income for the companies being studied, Ross Stores has the second highest revenue in the retailing-specialty-apparel category followed by the GAP. Urban Outfitters and Abercrombie and Fitch rank 5 and 6.
30/49
Enterprise Ranking - Return on Assets-Retailing-Specialty-Apparel

31
In terms of return on assets for the companies being studied, Ross Stores has the third highest revenue ROA in the retailing-specialty-apparel category followed by Abercrombie and Fitch. Urban Outfitters is ranked 8th and despite ranking high for total revenue and operating income the GAP ranks significantly below the other companies in Return on Assets
31/49
KPI Examination - Standard KPI examination for the GAP

33
The GAP fell in the normal category for all of the categories in the KPI examination. However their operating margin and cash conversion cycle fell below the median and their liability asset ratio was above the median.
33/49
Enterprise Comparison - Size- The GAP

36
Ross Stores significantly out performs the GAP in net income, profit before tax and operating income. The GAP is close to Ross Stores for total revenue and has a higher gross profit. The GAP significantly outperforms Abercrombie and Fitch and Urban Outfitters in total revenue and gross profit but is close to both of these companies in profit before tax, operating income and net income.
36/49
Enterprise Comparison - Profitability- The GAP

37
Abercrombie and Fitch, Ross Stores and Urban Outfitters outperform the GAP in operating margin, return on assets and net margin.
37/49
Enterprise Comparison - Return on Investment- The GAP

38
Ross Stores, Abercrombie and Fitch and Urban Outfitters outperform the GAP in Return on Assets and Return on Invested Capital.
38/49
Enterprise Trend - Size- The GAP

39
Total revenue for the GAP is similar to Ross stores. Operating income, profit before tax, and net income were similar to Ross stores prior to 2021 but are now closer to or below Abercrombie and Fitch and Urban Outfitters
39/49
Enterprise Trend - Financial Health- The GAP

40
The liability asset ratio, long term debt ratio and financial leverage are higher for the GAP than for Ross stores, Abercrombie and Fitch and Urban Outfitters.
40/49
Value Driver Analysis-Liability Asset Ratio Compared to Return on Assets- The GAP

42
The GAP has a higher liability asset ratio and lower return on assets than Ross Stores, Abercrombie and Fitch and Urban Outfitters
42/49
Value Driver Analysis- Gross Margin Compared to Total Revenue Growth Rate

43
The GAP has a negative total revenue growth rate.
43/49
Enterprise Breakdown - Revenue

45
The revenue breakdown for the GAP demonstrates lower than normal SG & A expenses, a high cost in the other cost category and lower net income than the industry average and lower than Ross Stores, Abercrombie and Fitch and Urban Outfitters.
45/49
Enterprise Breakdown - Detailed Assets

46
The detailed asset breakdown demonstrates that the GAP is close to the industry average in most categories except for the areas of total receivables which are higher than the industry average and the comparable companies and other assets which are lower than the industry average and the comparable companies.
46/49
Enterprise Breakdown - Liability-Equity

47
The GAP has higher total current liabilities and total non current liabilities and lower total stockholder equity than the industry average and the comparable companies.
47/49


